Image
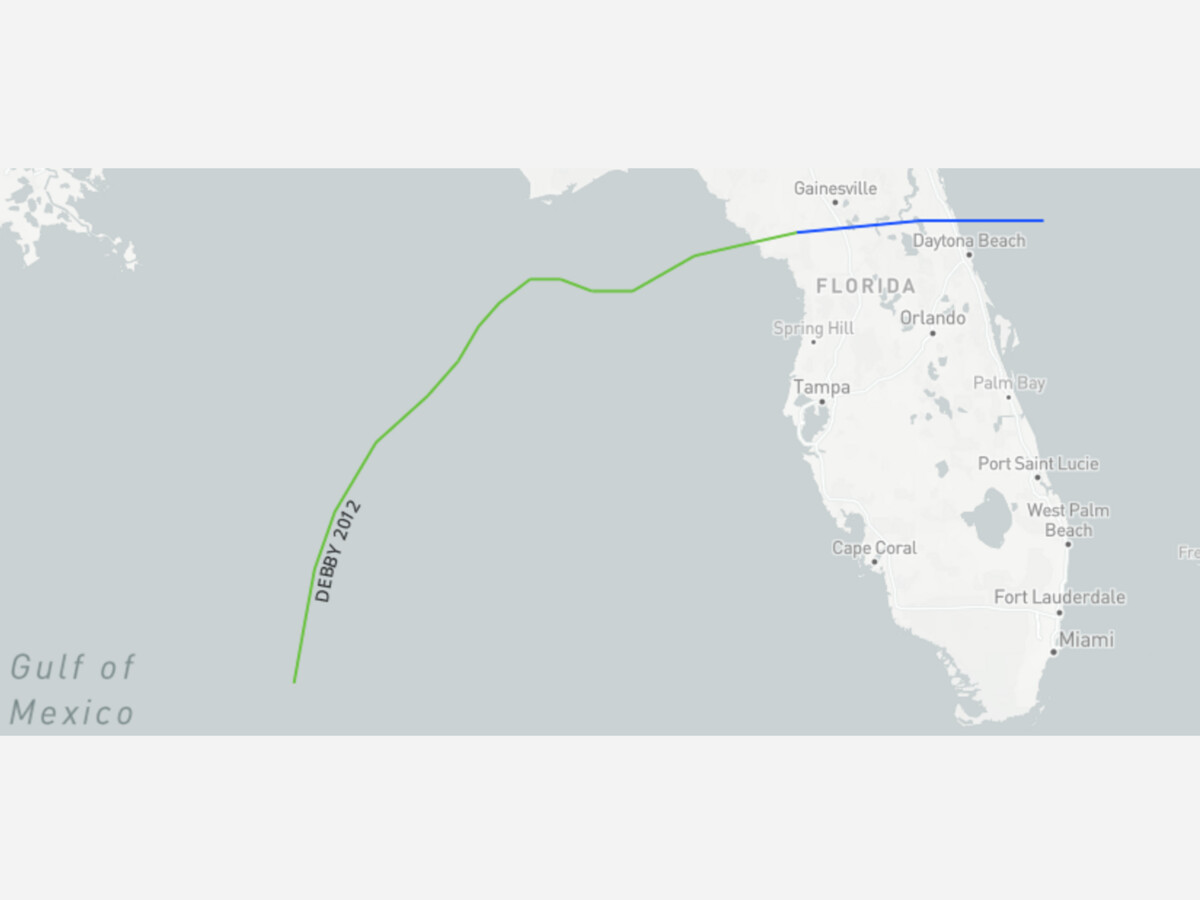
This was the track of Tropical Storm Debby in 2012

Understand the terminology :
A tropical cyclone is a rotating, organized system of clouds and thunderstorms that originates over tropical or subtropical waters and has a closed low-level circulation. Tropical cyclones rotate counterclockwise in the Northern Hemisphere. They are classified as follows:
Tropical cyclones forming between 5 and 30 degrees North latitude typically move toward the west. Sometimes the winds in the middle and upper levels of the atmosphere change and steer the cyclone toward the north and northwest. When tropical cyclones reach latitudes near 30 degrees North, they often move northeast.
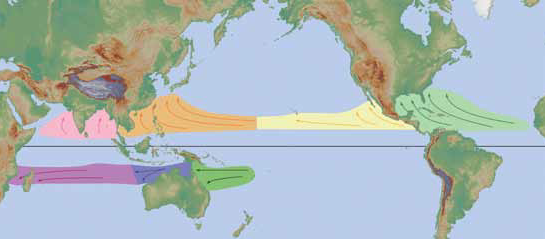
Tropical Cyclone formation regions with mean tracks (courtesy of the NWS JetStream Online School)
Hurricanes are among nature's most powerful and destructive phenomena. On average, 12 tropical storms, 6 of which become hurricanes form over the Atlantic Ocean, Caribbean Sea, or Gulf of Mexico during the hurricane season which runs from June 1 to November 30 each year. In the Central Pacific Ocean, an average of 3 tropical storms, 2 of which become hurricanes form or move over the area during the hurricane season, which runs from June 1 to November 30 each year. Guam, the Northern Marianas and Micronesia experience typhoons all year round but the main season in July through November with a peak from mid-August to mid-September. Over a typical 2-year period, the U.S. coastline is struck by an average of 3 hurricanes, 1 of which is classified as a major hurricane (winds of 111 mph or greater). By knowing what actions to take before the hurricane season begins, when a hurricane approaches, and when the storm is in your area, as well as what to do after a hurricane leaves your area, you can increase your chance of survival. Read stories from survivors and learn how to stay safe.
While hurricanes pose the greatest threat to life and property, tropical storms and depression also can be devastating. The primary hazards from tropical cyclones (which include tropical depressions, tropical storms, and hurricanes) are storm surge flooding, inland flooding from heavy rains, destructive winds, tornadoes, and high surf and rip currents.
The Atlantic hurricane season runs from June 1 to November 30. The Atlantic basin includes the Atlantic Ocean, Caribbean Sea, and Gulf of Mexico. Based on a 30-year climate period from 1991 to 2020, an average Atlantic hurricane season has 14 named storms, 7 hurricanes, and 3 major hurricanes (Category 3, 4, or 5 on the Saffir-Simpson Hurricane Wind Scale). The first named storm typically forms in mid to late June, the first hurricane tends to form in early to mid-August, and the first major hurricane forms in late August or early September.
The eastern Pacific hurricane season runs from May 15 to November 30. The eastern Pacific basin extends from Mexico and Central America westward to 140°W. Based on a 30-year climate period from 1991 to 2020, an average eastern Pacific hurricane season has 15 named storms, 8 hurricanes, and 4 major hurricanes. The first named storm typically forms in early to mid-June, the first hurricane tends to form in late June, and the first major hurricane forms in mid-July.
The following tables describe the progress of typical hurricane seasons in the Atlantic and eastern Pacific basins by showing benchmark dates when a given number of named storms, hurricanes, and major hurricanes typically forms. It is important to note, however, that formation dates in individual hurricane seasons could vary considerably from these average dates.
Table 1. Progress of the average Atlantic season (1991-2020). Date upon which the following number of events would normally have occurred.
| Number | Named systems | Hurricanes | Major Hurricanes |
|---|---|---|---|
| 1 | Jun 20 | Aug 11 | Sep 1 |
| 2 | Jul 17 | Aug 26 | Sep 19 |
| 3 | Aug 3 | Sep 7 | Oct 28 |
| 4 | Aug 15 | Sep 16 | - |
| 5 | Aug 22 | Sep 28 | - |
| 6 | Aug 29 | Oct 15 | - |
| 7 | Sep 3 | Nov 15 | - |
| 8 | Sep 9 | - | - |
| 9 | Sep 16 | - | - |
| 10 | Sep 22 | - | - |
| 11 | Oct 2 | - | - |
| 12 | Oct 11 | - | - |
| 13 | Oct 25 | - | - |
| 14 | Nov 19 | - | - |
Table 2. Progress of the average eastern Pacific season (1991-2020). Date upon which the following number of events would normally have occurred.
| Number | Named systems | Hurricanes | Major Hurricanes |
|---|---|---|---|
| 1 | Jun 10 | Jun 26 | Jul 15 |
| 2 | Jun 24 | Jul 15 | Aug 15 |
| 3 | Jul 6 | Jul 31 | Sep 13 |
| 4 | Jul 15 | Aug 16 | Oct 22 |
| 5 | Jul 23 | Aug 31 | - |
| 6 | Aug 3 | Sep 15 | - |
| 7 | Aug 11 | Sep 28 | - |
| 8 | Aug 21 | Oct 23 | - |
| 9 | Aug 28 | - | - |
| 10 | Sep 4 | - | - |
| 11 | Sep 14 | - | - |
| 12 | Sep 21 | - | - |
| 13 | Oct 2 | - | - |
| 14 | Oct 15 | - | - |
| 15 | Nov 5 | - | - |
If you want to take a deeper dive on the intellectual side into storm tracking of this incoming storm, check out https://www.nhc.noaa.gov/


Sunny, with a high of 101 and low of 78 degrees. Sunny in the morning, partly cloudy during the afternoon and evening, clear overnight.